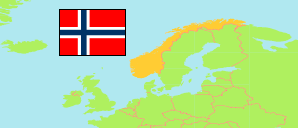
Finnmark
County in Norway
Contents: Subdivision
The population development in Finnmark as well as related information and services (Wikipedia, Google, images).
| Name | Status | Population Estimate 1986-01-01 | Population Estimate 1993-01-01 | Population Estimate 2000-01-01 | Population Estimate 2006-01-01 | Population Estimate 2013-01-01 | Population Estimate 2020-01-01 | Population Estimate 2025-01-01 | |
|---|---|---|---|---|---|---|---|---|---|
| Finnmark (Finnmárku, Finmarkku) | County | 75,668 | 75,975 | 74,059 | 72,937 | 74,534 | 75,472 | 75,042 | |
| Alta | Municipality | 14,000 | 15,838 | 16,837 | 17,889 | 19,646 | 20,789 | 21,877 | → |
| Båtsfjord | Municipality | 2,643 | 2,370 | 2,470 | 2,171 | 2,162 | 2,221 | 2,107 | → |
| Berlevåg | Municipality | 1,533 | 1,320 | 1,236 | 1,104 | 1,025 | 957 | 890 | → |
| Deatnu (Tana) | Municipality | 3,309 | 3,299 | 3,074 | 3,006 | 2,900 | 2,918 | 2,798 | → |
| Gamvik | Municipality | 1,523 | 1,423 | 1,288 | 1,076 | 1,063 | 1,132 | 1,051 | → |
| Guovdageaidnu (Kautokeino) | Municipality | 2,925 | 3,080 | 3,068 | 2,998 | 2,923 | 2,910 | 2,852 | → |
| Hammerfest (Hámmerfeasta) | Municipality | 10,911 | 10,747 | 10,319 | 10,431 | 11,108 | 11,448 | 11,324 | → |
| Hasvik | Municipality | 1,537 | 1,403 | 1,200 | 1,033 | 1,023 | 1,005 | 977 | → |
| Kárášjohka (Karasjok) | Municipality | 2,694 | 2,757 | 2,901 | 2,889 | 2,721 | 2,628 | 2,524 | → |
| Lebesby | Municipality | 1,811 | 1,630 | 1,463 | 1,391 | 1,339 | 1,290 | 1,238 | → |
| Loppa | Municipality | 1,922 | 1,599 | 1,426 | 1,213 | 1,070 | 888 | 864 | → |
| Måsøy | Municipality | 2,018 | 1,806 | 1,477 | 1,376 | 1,240 | 1,225 | 1,098 | → |
| Nordkapp | Municipality | 4,393 | 3,962 | 3,517 | 3,330 | 3,205 | 3,162 | 2,956 | → |
| Porsanger (Porsáŋgu, Porsanki) | Municipality | 4,389 | 4,535 | 4,451 | 4,222 | 3,968 | 3,998 | 3,896 | → |
| Sør-Varanger | Municipality | 9,853 | 9,819 | 9,532 | 9,464 | 9,968 | 10,158 | 9,963 | → |
| Unjárga (Nesseby) | Municipality | 1,006 | 1,059 | 965 | 892 | 882 | 926 | 868 | → |
| Vadsø | Municipality | 5,958 | 6,282 | 6,130 | 6,114 | 6,163 | 5,788 | 5,777 | → |
| Vardø | Municipality | 3,243 | 3,046 | 2,705 | 2,338 | 2,128 | 2,029 | 1,982 | → |
| Norge (Noreg) [Norway] | Kingdom | 4,159,187 | 4,299,167 | 4,478,497 | 4,640,219 | 5,051,275 | 5,367,580 | 5,594,340 |
Source: Statistics Norway.
Explanation: Counties according to the reestablishment of former counties by 1 January 2024.
Further information about the population structure:
| Gender (E 2025) | |
|---|---|
| Males | 38,497 |
| Females | 36,545 |
| Age Groups (E 2025) | |
|---|---|
| 0-17 years | 13,953 |
| 18-64 years | 46,020 |
| 65+ years | 15,069 |
| Age Distribution (E 2025) | |
|---|---|
| 90+ years | 546 |
| 80-89 years | 3,059 |
| 70-79 years | 7,283 |
| 60-69 years | 9,055 |
| 50-59 years | 11,039 |
| 40-49 years | 8,383 |
| 30-39 years | 10,188 |
| 20-29 years | 9,802 |
| 10-19 years | 8,378 |
| 0-9 years | 7,309 |
| Citizenship (E 2025) | |
|---|---|
| Norway | 66,077 |
| Foreign Citizenship | 8,965 |
| Country of Birth (E 2025) | |
|---|---|
| Norway | 75,042 |
