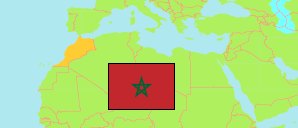
Figuig
Province in Morocco
Contents: Population
The population development of Figuig as well as related information and services (Wikipedia, Google, images).
| Name | Status | Native | Population Census 1994-09-02 | Population Census 2004-09-02 | Population Census 2014-09-01 | Population Projection 2023-07-01 | |
|---|---|---|---|---|---|---|---|
| Figuig | Province | فجيج | 117,011 | 129,430 | 138,325 | 140,251 | |
| Al-Maghrib [Morocco] | Kingdom | المغرب | 25,821,571 | 29,475,763 | 33,337,529 | 36,403,782 |
Source: Haut Commissariat au Plan, Royaume du Maroc.
Explanation: Some population changes between 2004 and 2014 are due to boundary changes.
Further information about the population structure:
| Gender (C 2014) | |
|---|---|
| Males | 66,192 |
| Females | 69,411 |
| Age Groups (C 2014) | |
|---|---|
| 0-14 years | 43,843 |
| 15-64 years | 83,172 |
| 65+ years | 8,588 |
| Age Distribution (C 2014) | |
|---|---|
| 70+ years | 6,041 |
| 60-69 years | 6,290 |
| 50-59 years | 11,488 |
| 40-49 years | 14,182 |
| 30-39 years | 18,104 |
| 20-29 years | 22,020 |
| 10-19 years | 26,744 |
| 0-9 years | 30,734 |
| Urbanization (C 2014) | |
|---|---|
| Rural | 69,142 |
| Urban | 66,461 |
| Citizenship (C 2014) | |
|---|---|
| Morocco | 138,284 |
| Foreign Citizenship | 41 |
| Literacy (A10+) (C 2014) | |
|---|---|
| yes | 87,173 |
| no | 48,430 |