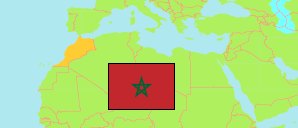
Al Haouz
Province in Morocco
Contents: Population
The population development of Al Haouz as well as related information and services (Wikipedia, Google, images).
| Name | Status | Native | Population Census 1994-09-02 | Population Census 2004-09-02 | Population Census 2014-09-01 | Population Projection 2023-07-01 | |
|---|---|---|---|---|---|---|---|
| Al Haouz | Province | الحوز | 435,090 | 484,312 | 573,128 | 669,026 | |
| Al-Maghrib [Morocco] | Kingdom | المغرب | 25,821,571 | 29,475,763 | 33,337,529 | 36,403,782 |
Source: Haut Commissariat au Plan, Royaume du Maroc.
Explanation: Some population changes between 2004 and 2014 are due to boundary changes.
Further information about the population structure:
| Gender (C 2014) | |
|---|---|
| Males | 291,795 |
| Females | 280,204 |
| Age Groups (C 2014) | |
|---|---|
| 0-14 years | 179,471 |
| 15-64 years | 358,409 |
| 65+ years | 34,119 |
| Age Distribution (C 2014) | |
|---|---|
| 70+ years | 23,322 |
| 60-69 years | 29,141 |
| 50-59 years | 46,993 |
| 40-49 years | 59,291 |
| 30-39 years | 80,227 |
| 20-29 years | 98,356 |
| 10-19 years | 110,774 |
| 0-9 years | 123,895 |
| Urbanization (C 2014) | |
|---|---|
| Rural | 487,794 |
| Urban | 84,205 |
| Citizenship (C 2014) | |
|---|---|
| Morocco | 572,766 |
| Foreign Citizenship | 362 |
| Literacy (A10+) (C 2014) | |
|---|---|
| yes | 374,319 |
| no | 197,680 |