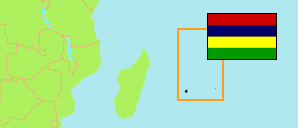
Mauritius: Rodrigues Island
Contents: Rodrigues
Island
40,434 Population [2011] – census
43,604 Population [2022] – census
110.0km² Area
396.4/km² Density [2022]
0.69% Annual Population Change [2011 → 2022]
Contents: Regions
The population of the regions of Rodrigues island according to census results.
| Name | Status | Population Census 2011-07-03 | Population Census 2022-07-03 | |
|---|---|---|---|---|
| Baie aux Huîtres (Region 4) | Region | 6,077 | 6,201 | → |
| Grande Montagne (Region 6) | Region | 6,567 | 7,344 | → |
| La Ferme (Region 1) | Region | 6,901 | 7,578 | → |
| Maréchal (Region 2) | Region | 5,690 | 6,273 | → |
| Port Mathurin (Region 5) | Region | 7,705 | 8,004 | → |
| Saint Gabriel (Region 3) | Region | 7,494 | 8,204 | → |
| Rodrigues | Island | 40,434 | 43,604 |
Source: Central Statistical Office of Mauritius.
Explanation: Area figures are computed by using geospatial data.
Further information about the population structure:
| Gender (C 2022) | |
|---|---|
| Males | 21,311 |
| Females | 22,293 |
| Age Groups (C 2022) | |
|---|---|
| 0-14 years | 11,681 |
| 15-64 years | 28,213 |
| 65+ years | 3,710 |
| Age Distribution (C 2022) | |
|---|---|
| 70+ years | 2,332 |
| 60-69 years | 3,216 |
| 50-59 years | 4,443 |
| 40-49 years | 6,079 |
| 30-39 years | 5,681 |
| 20-29 years | 6,076 |
| 10-19 years | 7,952 |
| 0-9 years | 7,825 |
| Urbanization (C 2022) | |
|---|---|
| Rural | 43,604 |
| Language at Home (C 2022) | |
|---|---|
| Creole | 43,423 |
| French | 117 |
| English | 22 |
| Bhojpuri | 6 |
| Bengali | 5 |
| Hindi | 8 |
| Other language | 23 |
| Religion (C 2022) | |
|---|---|
| Hindus | 291 |
| Muslims | 372 |
| Buddhists | 10 |
| Roman Catholics | 38,220 |
| Other Christians | 4,326 |
| Other/no religion | 385 |
