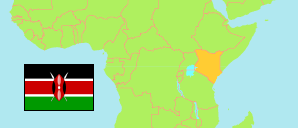
Kiambu
County in Kenya
Contents: Subdivision
The population development in Kiambu as well as related information and services (Wikipedia, Google, images).
| Name | Status | Population Census 2009-08-24 | Population Census 2019-08-24 | |
|---|---|---|---|---|
| Kiambu | County | 1,623,282 | 2,417,735 | |
| Gatundu North | Subcounty | 106,376 | 109,870 | → |
| Gatundu South | Subcounty | 108,415 | 122,103 | → |
| Githunguri | Subcounty | 147,763 | 165,232 | → |
| Juja | Subcounty | 118,793 | 300,948 | → |
| Kabete | Subcounty | 140,427 | 199,653 | → |
| Kiambaa | Subcounty | 145,053 | 236,400 | → |
| Kiambu | Subcounty | 108,698 | 145,903 | → |
| Kikuyu | Subcounty | 125,402 | 187,122 | → |
| Lari | Subcounty | 123,895 | 135,303 | → |
| Limuru | Subcounty | 131,132 | 159,314 | → |
| Ruiru | Subcounty | 201,986 | 371,111 | → |
| Thika East | Subcounty | 26,570 | 38,956 | → |
| Thika West | Subcounty | 138,772 | 245,820 | → |
| Kenya | Republic | 38,610,097 | 47,564,296 |
Source: Kenya National Bureau of Statistics.
Further information about the population structure:
| Gender (C 2019) | |
|---|---|
| Males | 1,187,146 |
| Females | 1,230,454 |
| Intersex | 135 |
| Age Groups (C 2019) | |
|---|---|
| 0-14 years | 747,271 |
| 15-64 years | 1,584,244 |
| 65+ years | 86,037 |
| Age Distribution (C 2019) | |
|---|---|
| 90+ years | 4,546 |
| 80-89 years | 14,400 |
| 70-79 years | 37,116 |
| 60-69 years | 68,960 |
| 50-59 years | 144,707 |
| 40-49 years | 255,653 |
| 30-39 years | 410,924 |
| 20-29 years | 522,054 |
| 10-19 years | 439,251 |
| 0-9 years | 519,941 |