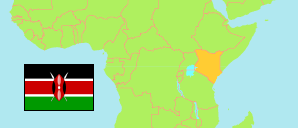
Garissa
County in Kenya
Contents: Population
The population development of Garissa as well as related information and services (Wikipedia, Google, images).
| Name | Status | Population Census 1979-08-24 | Population Census 1989-08-24 | Population Census 1999-08-24 | Population Census 2009-08-24 | Population Census 2019-08-24 | Population Projection 2023-07-01 | |
|---|---|---|---|---|---|---|---|---|
| Garissa | County | 128,867 | 124,835 | 392,510 | 623,060 | 841,353 | 927,031 | |
| Kenya | Republic | 15,327,061 | 21,443,636 | 28,686,607 | 38,610,097 | 47,564,296 | 51,525,602 |
Source: Kenya National Bureau of Statistics.
Further information about the population structure:
| Gender (P 2023) | |
|---|---|
| Males | 458,525 |
| Females | 468,506 |
| Age Groups (P 2023) | |
|---|---|
| 0-14 years | 375,635 |
| 15-64 years | 526,644 |
| 65+ years | 24,750 |
| Age Distribution (P 2023) | |
|---|---|
| 80+ years | 4,631 |
| 70-79 years | 9,217 |
| 60-69 years | 25,375 |
| 50-59 years | 36,410 |
| 40-49 years | 73,458 |
| 30-39 years | 117,890 |
| 20-29 years | 176,016 |
| 10-19 years | 225,702 |
| 0-9 years | 258,330 |
| Urbanization (C 2019) | |
|---|---|
| Rural | 630,463 |
| Urban | 210,890 |
| Religion (C 2019) | |
|---|---|
| Catholic s | 7,919 |
| Protestants | 4,253 |
| Evangelicals | 800 |
| Other Christians | 5,583 |
| Muslims | 815,755 |
| Hindus | 529 |
| Traditional religion | 11 |
| Other religion | 222 |
| No Religion | 98 |
