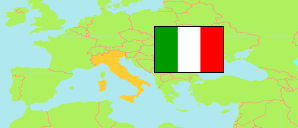
Gorga
in Roma (Lazio)
Contents: Commune
The population development of Gorga as well as related information and services (weather, Wikipedia, Google, images).
| Name | Province | Population Census 1981-10-25 | Population Census 1991-10-20 | Population Census 2001-10-21 | Population Census 2011-10-09 | Population Census 2021-12-31 | Population Estimate 2025-01-01 | |
|---|---|---|---|---|---|---|---|---|
| Gorga | Roma | 754 | 778 | 764 | 767 | 689 | 653 | → |
Source: Istituto Nazionale di Statistica Italia.
Explanation: The 2025 figures are preliminary.
Further information about the population structure:
| Gender (E 2025) | |
|---|---|
| Males | 338 |
| Females | 315 |
| Age Groups (E 2025) | |
|---|---|
| 0-17 years | 94 |
| 18-64 years | 355 |
| 65+ years | 204 |
| Age Distribution (E 2025) | |
|---|---|
| 90+ years | 9 |
| 80-89 years | 56 |
| 70-79 years | 90 |
| 60-69 years | 96 |
| 50-59 years | 99 |
| 40-49 years | 87 |
| 30-39 years | 72 |
| 20-29 years | 43 |
| 10-19 years | 45 |
| 0-9 years | 56 |
| Citizenship (E 2025) | |
|---|---|
| Italy | 623 |
| Foreign Citizenship | 30 |
