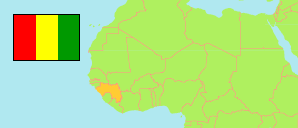
Télimélé
Prefecture in Guinea
Contents: Subdivision
The population development in Télimélé as well as related information and services (Wikipedia, Google, images).
| Name | Status | Population Census 1996-12-31 | Population Census 2014-03-01 | |
|---|---|---|---|---|
| Télimélé | Prefecture | 228,380 | 284,409 | |
| Bourouwal | Sub-Prefecture | 23,915 | 25,410 | → |
| Daramagnaky | Sub-Prefecture | 26,382 | 33,229 | → |
| Gougoudjé | Sub-Prefecture | 9,511 | 10,790 | → |
| Koba | Sub-Prefecture | 5,068 | 9,439 | → |
| Kollet | Sub-Prefecture | 16,624 | 21,191 | → |
| Konsotamy | Sub-Prefecture | 11,099 | 12,979 | → |
| Missira | Sub-Prefecture | 33,284 | 43,681 | → |
| Santou | Sub-Prefecture | 12,381 | 13,832 | → |
| Sarekaly | Sub-Prefecture | 13,016 | 14,889 | → |
| Sinta | Sub-Prefecture | 18,558 | 20,614 | → |
| Sogolon | Sub-Prefecture | 16,958 | 25,653 | → |
| Tarihoye | Sub-Prefecture | 11,190 | 14,655 | → |
| Télimélé-Centre | Urban Commune | 21,924 | 24,761 | → |
| Thionthian | Sub-Prefecture | 10,718 | 13,286 | → |
| Guinea | Republic | 7,156,406 | 10,523,261 |
Source: Institut National de la Statistique de Guinée (web).
Explanation: The 1996 population of sub-prefectures and urban communes shows slight discrepancies compared to the population of prefectures.
Further information about the population structure:
| Gender (C 2014) | |
|---|---|
| Males | 129,954 |
| Females | 154,455 |
| Age Groups (P 2014) | |
|---|---|
| 0-14 years | 155,060 |
| 15-64 years | 151,154 |
| 65+ years | 15,454 |
| Age Distribution (P 2014) | |
|---|---|
| 0-9 years | 112,921 |
| 10-19 years | 70,098 |
| 20-29 years | 41,137 |
| 30-39 years | 33,209 |
| 40-49 years | 24,704 |
| 50-59 years | 17,209 |
| 60-69 years | 12,811 |
| 70-79 years | 7,081 |
| 80+ years | 2,498 |
| Urbanization (C 2014) | |
|---|---|
| Rural | 271,095 |
| Urban | 13,314 |