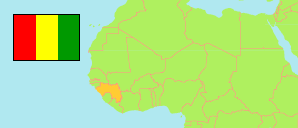
Kindia
Prefecture in Guinea
Contents: Subdivision
The population development in Kindia as well as related information and services (Wikipedia, Google, images).
| Name | Status | Population Census 1996-12-31 | Population Census 2014-03-01 | |
|---|---|---|---|---|
| Kindia | Prefecture | 287,611 | 439,614 | |
| Bangouyah | Sub-Prefecture | 38,044 | 52,923 | → |
| Damankanyah | Sub-Prefecture | 12,148 | 25,897 | → |
| Friguiagbé | Sub-Prefecture | 21,224 | 34,062 | → |
| Kindia-Centre | Urban Commune | 120,664 | 170,557 | → |
| Kolenté | Sub-Prefecture | 19,825 | 31,312 | → |
| Madina-Oula | Sub-Prefecture | 15,225 | 23,381 | → |
| Mambia | Sub-Prefecture | 19,301 | 26,500 | → |
| Molota | Sub-Prefecture | 10,626 | 12,109 | → |
| Samayah | Sub-Prefecture | 13,162 | 21,292 | → |
| Souguéta | Sub-Prefecture | 22,220 | 41,581 | → |
| Guinea | Republic | 7,156,406 | 10,523,261 |
Source: Institut National de la Statistique de Guinée (web).
Explanation: The 1996 population of sub-prefectures and urban communes shows slight discrepancies compared to the population of prefectures.
Further information about the population structure:
| Gender (C 2014) | |
|---|---|
| Males | 212,994 |
| Females | 226,620 |
| Age Groups (P 2014) | |
|---|---|
| 0-14 years | 227,268 |
| 15-64 years | 250,717 |
| 65+ years | 18,645 |
| Age Distribution (P 2014) | |
|---|---|
| 0-9 years | 163,408 |
| 10-19 years | 114,607 |
| 20-29 years | 77,901 |
| 30-39 years | 52,421 |
| 40-49 years | 36,439 |
| 50-59 years | 23,915 |
| 60-69 years | 15,528 |
| 70-79 years | 8,327 |
| 80+ years | 4,084 |
| Urbanization (C 2014) | |
|---|---|
| Rural | 300,919 |
| Urban | 138,695 |