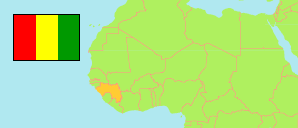
Mandiana
Prefecture in Guinea
Contents: Subdivision
The population development in Mandiana as well as related information and services (Wikipedia, Google, images).
| Name | Status | Population Census 1996-12-31 | Population Census 2014-03-01 | |
|---|---|---|---|---|
| Mandiana | Prefecture | 173,150 | 335,999 | |
| Balandougouba | Sub-Prefecture | 16,753 | 28,686 | → |
| Dialakoro | Sub-Prefecture | 30,163 | 63,051 | → |
| Faralako | Sub-Prefecture | 10,236 | 23,954 | → |
| Kantoumania | Sub-Prefecture | 5,986 | 11,711 | → |
| Kiniéran | Sub-Prefecture | 21,979 | 37,877 | → |
| Kondianakoro | Sub-Prefecture | 15,708 | 31,503 | → |
| Koundian | Sub-Prefecture | 16,246 | 32,353 | → |
| Mandiana-Centre | Urban Commune | 9,572 | 22,719 | → |
| Morodou | Sub-Prefecture | 16,279 | 28,431 | → |
| Niantania | Sub-Prefecture | 8,289 | 14,523 | → |
| Saladou | Sub-Prefecture | 11,857 | 18,246 | → |
| Sansando | Sub-Prefecture | 13,729 | 22,945 | → |
| Guinea | Republic | 7,156,406 | 10,523,261 |
Source: Institut National de la Statistique de Guinée (web).
Explanation: The 1996 population of sub-prefectures and urban communes shows slight discrepancies compared to the population of prefectures.
Further information about the population structure:
| Gender (C 2014) | |
|---|---|
| Males | 167,873 |
| Females | 168,126 |
| Age Groups (P 2014) | |
|---|---|
| 0-14 years | 191,341 |
| 15-64 years | 178,695 |
| 65+ years | 10,056 |
| Age Distribution (P 2014) | |
|---|---|
| 0-9 years | 144,573 |
| 10-19 years | 86,855 |
| 20-29 years | 59,435 |
| 30-39 years | 38,821 |
| 40-49 years | 22,516 |
| 50-59 years | 13,316 |
| 60-69 years | 8,527 |
| 70-79 years | 4,293 |
| 80+ years | 1,756 |
| Urbanization (C 2014) | |
|---|---|
| Rural | 319,539 |
| Urban | 16,460 |