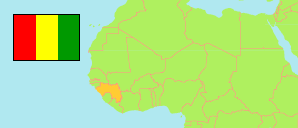
Faranah
Prefecture in Guinea
Contents: Subdivision
The population development in Faranah as well as related information and services (Wikipedia, Google, images).
| Name | Status | Population Census 1996-12-31 | Population Census 2014-03-01 | |
|---|---|---|---|---|
| Faranah | Prefecture | 147,347 | 280,170 | |
| Banian | Sub-Prefecture | 20,595 | 36,634 | → |
| Beindou | Sub-Prefecture | 8,581 | 16,630 | → |
| Faranah-Centre | Urban Commune | 45,066 | 77,918 | → |
| Gnaléah | Sub-Prefecture | 7,162 | 14,642 | → |
| Herémakonon | Sub-Prefecture | 8,486 | 13,078 | → |
| Kobikoro | Sub-Prefecture | 7,807 | 13,909 | → |
| Maréla | Sub-Prefecture | 16,410 | 32,646 | → |
| Passayah | Sub-Prefecture | 10,811 | 19,862 | → |
| Sandéniah | Sub-Prefecture | 11,178 | 17,577 | → |
| Songoyah | Sub-Prefecture | 5,711 | 13,330 | → |
| Tindo | Sub-Prefecture | ... | 5,052 | → |
| Tiro | Sub-Prefecture | 8,828 | 18,892 | → |
| Guinea | Republic | 7,156,406 | 10,523,261 |
Source: Institut National de la Statistique de Guinée (web).
Explanation: The 1996 population of sub-prefectures and urban communes shows slight discrepancies compared to the population of prefectures.
Further information about the population structure:
| Gender (C 2014) | |
|---|---|
| Males | 134,663 |
| Females | 145,507 |
| Age Groups (P 2014) | |
|---|---|
| 0-14 years | 151,119 |
| 15-64 years | 154,578 |
| 65+ years | 11,267 |
| Age Distribution (P 2014) | |
|---|---|
| 0-9 years | 109,248 |
| 10-19 years | 73,777 |
| 20-29 years | 44,869 |
| 30-39 years | 34,443 |
| 40-49 years | 23,023 |
| 50-59 years | 14,936 |
| 60-69 years | 9,324 |
| 70-79 years | 5,209 |
| 80+ years | 2,135 |
| Urbanization (C 2014) | |
|---|---|
| Rural | 219,721 |
| Urban | 60,449 |