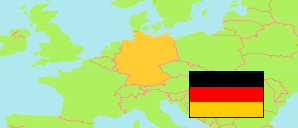
Kulmbach
County in Bavaria
County
The population of Kulmbach.
| Name | Status | Population Census 2011-05-09 | |
|---|---|---|---|
| Kulmbach | County | 74,071 | → |
| Bayern [Bavaria] | State | 12,397,614 |
Contents: Settlements
The population of the settlements in Kulmbach.
| Name | Status | County | Population Census 2011-05-09 | |
|---|---|---|---|---|
| Burghaig - Seidenhof | Settlement | Kulmbach | 1,930 | → |
| Harsdorf | Settlement | Kulmbach | 740 | → |
| Himmelkron | Settlement | Kulmbach | 1,870 | → |
| Kasendorf | Settlement | Kulmbach | 920 | → |
| Katschenreuth | Settlement | Kulmbach | 700 | → |
| Kauernburg | Settlement | Kulmbach | 510 | → |
| Kauerndorf - Fölschnitz | Settlement | Kulmbach | 1,030 | → |
| Kulmbach | Settlement | Kulmbach | 20,000 | → |
| Kupferberg | Settlement | Kulmbach | 990 | → |
| Lanzendorf | Settlement | Kulmbach | 870 | → |
| Ludwigschorgast | Settlement | Kulmbach | 990 | → |
| Mainleus | Settlement | Kulmbach | 2,630 | → |
| Marktleugast | Settlement | Kulmbach | 1,470 | → |
| Marktschorgast | Settlement | Kulmbach | 1,330 | → |
| Melkendorf | Settlement | Kulmbach | 680 | → |
| Neudrossenfeld | Settlement | Kulmbach | 2,060 | → |
| Neuenmarkt | Settlement | Kulmbach | 2,730 | → |
| Presseck | Settlement | Kulmbach | 680 | → |
| Rothwind | Settlement | Kulmbach | 570 | → |
| Rugendorf | Settlement | Kulmbach | 630 | → |
| Schmeilsdorf - Schwarzach bei Kulmbach | Settlement | Kulmbach | 1,000 | → |
| Stadtsteinach | Settlement | Kulmbach | 2,400 | → |
| Thurnau | Settlement | Kulmbach | 2,320 | → |
| Trebgast | Settlement | Kulmbach | 1,230 | → |
| Untersteinach | Settlement | Kulmbach | 1,740 | → |
| Veitlahm | Settlement | Kulmbach | 500 | → |
| Wirsberg | Settlement | Kulmbach | 1,500 | → |
Source: Boundaries and population of settlements are computed by »City Population« using population figures in a 100m grid provided by the Statistisches Bundesamt Deutschland (web) and using geospatial data of the Bundesamt für Kartographie und Geodäsie (web). The settlements are delimited by unsettled and not built-up areas as well as by municipal boundaries.
Because of the computation method, the above population figures are not exact and therefore rounded. Area figures are derived from geospatial data.