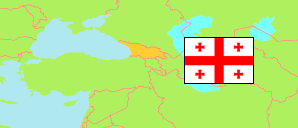
Achara
Autonomous Republic in Administrative Division
Contents: Subdivision
The population development in Achara as well as related information and services (Wikipedia, Google, images).
| Name | Status | Native | Population Census 1989-01-12 | Population Census 2002-01-17 | Population Census 2014-11-05 | Population Census 2024-11-14 | |
|---|---|---|---|---|---|---|---|
| Achara [Adjara] | Autonomous Republic | აჭარა | 392,432 | 376,016 | 333,953 | 401,100 | |
| Batumi | City | ბათუმი | ... | 155,176 | 152,839 | 234,600 | → |
| Keda | Municipality | ქედის მუნიციპალიტეტი | 20,061 | 20,024 | 16,760 | 14,500 | → |
| Khelvachauri | Municipality | ხელვაჩაურის მუნიციპალიტეტი | ... | 57,473 | 51,189 | 51,500 | → |
| Khulo | Municipality | ხულოს მუნიციპალიტეტი | 39,629 | 33,430 | 23,327 | 16,500 | → |
| Kobuleti | Municipality | ქობულეთის მუნიციპალიტეტი | 88,183 | 88,063 | 74,794 | 73,100 | → |
| Shuakhevi | Municipality | შუახევის მუნიციპალიტეტი | 25,386 | 21,850 | 15,044 | 10,900 | → |
| Sakartwelo [Georgia] | Areas under control of the central government | საქართველო | 4,921,955 | 4,361,876 | 3,713,804 | 3,914,000 |
Source: National Statistics Office of Georgia, pop-stat.mashke.org.
Explanation: The results of the 2024 census are preliminary. Area figures are computed by using geospatial data.
Further information about the population structure:
| Gender (C 2024) | |
|---|---|
| Males | 193,700 |
| Females | 207,300 |
| Age Groups (C 2014) | |
|---|---|
| 0-14 years | 65,683 |
| 15-64 years | 231,674 |
| 65+ years | 36,596 |
| Age Distribution (C 2014) | |
|---|---|
| 0-9 years | 45,972 |
| 10-19 years | 41,577 |
| 20-29 years | 54,875 |
| 30-39 years | 49,833 |
| 40-49 years | 46,820 |
| 50-59 years | 42,593 |
| 60-69 years | 27,549 |
| 70-79 years | 17,946 |
| 80+ years | 6,788 |
| Urbanization (C 2024) | |
|---|---|
| Rural | 136,200 |
| Urban | 264,900 |
| Internally Displaced Persons (C 2014) | |
|---|---|
| no IDP | 331,000 |
| IDP | 3,000 |
| Ethnic Group (C 2014) | |
|---|---|
| Georgians | 320,742 |
| Armenians | 5,461 |
| Azeris | 340 |
| Other group | 7,304 |
| Religion (C 2014) | |
|---|---|
| Orthodox | 182,041 |
| Armenian Apostolic Church | 1,082 |
| Muslims | 132,852 |
| Other religion | 604 |
| No religion | 9,233 |
