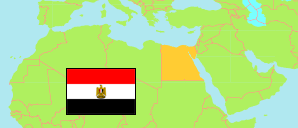
Banī Suwayf
Governorate in Egypt
Contents: Subdivision
The population development in Banī Suwayf as well as related information and services (Wikipedia, Google, images).
| Name | Status | Native | Population Census 1996-11-19 | Population Census 2006-11-11 | Population Census 2017-03-28 | Population Estimate 2023-07-01 | |
|---|---|---|---|---|---|---|---|
| Banī Suwayf [Beni Suef] | Governorate | بنى سويف | 1,859,213 | 2,291,618 | 3,154,100 | 3,592,039 | |
| Al-Fashn | Markaz | مركز الفشن | 270,931 | 337,132 | 468,352 | 531,904 | → |
| Al-Wāsiṭā | Markaz | مركز الواسطى | 292,805 | 358,741 | 490,981 | 549,614 | → |
| Banī Suwayf [Beni Suef] | Kism (fully urban) | قسم بنى سويف | 171,734 | 193,048 | 233,808 | 294,125 | → |
| Banī Suwayf [Beni Suef] | Markaz | مركز بنى سويف | 242,969 | 298,047 | 429,379 | 473,978 | → |
| Bibā | Markaz | مركز ببا | 268,724 | 329,234 | 467,065 | 528,065 | → |
| Ihnāsiyā | Markaz | مركز أهناسيا | 226,434 | 283,514 | 389,755 | 438,687 | → |
| Madīnat Banī Suwayf al-Jadīdah [New Beni Suef] | Kism (fully urban) | قسم مدينة بنى سويف الجديدة | 208 | 17,921 | 27,629 | 34,757 | → |
| Nāṣir [Nasser] | Markaz | مركز ناصر | 225,166 | 273,542 | 371,358 | 427,926 | → |
| Sumusṭā al-Waqf | Markaz | مركز سمسطا | 160,242 | 200,439 | 275,773 | 312,983 | → |
| Miṣr [Egypt] | Republic | مِصر | 59,276,672 | 72,798,031 | 94,798,827 | 105,174,090 |
Source: Central Agency for Public Mobilization and Statistics (CAPMAS), Egypt.
Explanation: Some figures for 2006 are computed using preliminary census results. Area figures of districts are derived from geospatial data.
Further information about the population structure:
| Gender (E 2023) | |
|---|---|
| Males | 1,849,134 |
| Females | 1,742,905 |
| Age Groups (C 2017) | |
|---|---|
| 0-14 years | 1,210,788 |
| 15-64 years | 1,830,546 |
| 65+ years | 112,766 |
| Age Distribution (C 2017) | |
|---|---|
| 90+ years | 2,223 |
| 80-89 years | 13,512 |
| 70-79 years | 45,500 |
| 60-69 years | 124,415 |
| 50-59 years | 198,054 |
| 40-49 years | 271,002 |
| 30-39 years | 416,965 |
| 20-29 years | 557,978 |
| 10-19 years | 630,726 |
| 0-9 years | 893,725 |
| Urbanization (E 2023) | |
|---|---|
| Rural | 2,691,377 |
| Urban | 900,662 |