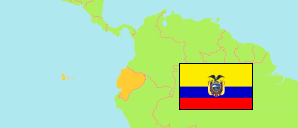
Chordeleg
Parish in Ecuador
Contents: Population
The population development of Chordeleg as well as related information and services (Wikipedia, Google, images).
| Name | Status | Population Census 2001-11-25 | Population Census 2010-11-28 | Population Census 2022-11-30 | |
|---|---|---|---|---|---|
| Chordeleg | Parish | 5,478 | 6,787 | 6,907 | |
| Ecuador | Republic | 12,156,608 | 14,483,499 | 16,938,986 |
Source: Instituto Nacional de Estadística y Censos del Ecuador.
Explanation: Census figures are not adjusted for underenumeration.
Further information about the population structure:
| Gender (C 2022) | |
|---|---|
| Males | 3,189 |
| Females | 3,718 |
| Age Groups (C 2022) | |
|---|---|
| 0-14 years | 1,869 |
| 15-64 years | 4,278 |
| 65+ years | 760 |
| Age Distribution (C 2022) | |
|---|---|
| 90+ years | 76 |
| 80-89 years | 170 |
| 70-79 years | 299 |
| 60-69 years | 467 |
| 50-59 years | 614 |
| 40-49 years | 747 |
| 30-39 years | 990 |
| 20-29 years | 1,086 |
| 10-19 years | 1,296 |
| 0-9 years | 1,162 |
| Urbanization (C 2022) | |
|---|---|
| Rural | 2,462 |
| Urban | 4,445 |
| Citizenship (C 2022) | |
|---|---|
| Ecuador | 6,879 |
| Other | 28 |
| Place of Birth (C 2022) | |
|---|---|
| Same parish | 3,944 |
| Other parish | 2,885 |
| Other country | 78 |
| Ethnic Group (C 2022) | |
|---|---|
| Indigenous | 15 |
| Afro-Ecuadorian | 33 |
| Montubios | 24 |
| Mestizos | 6,754 |
| White | 81 |