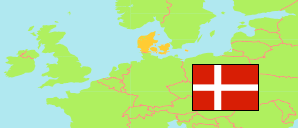
Odense
Municipality in Syddanmark
Municipality
The population development of Odense.
| Name | Status | Population Estimate 2006-01-01 | Population Estimate 2011-01-01 | Population Estimate 2016-01-01 | Population Estimate 2021-01-01 | Population Estimate 2025-01-01 | |
|---|---|---|---|---|---|---|---|
| Odense | Municipality | 186,595 | 190,245 | 198,972 | 205,509 | 210,803 | → |
| Syddanmark [South Denmark] | Region | 1,185,851 | 1,200,656 | 1,211,770 | 1,223,634 | 1,240,472 |
Contents: Urban Settlements
The population development of the urban settlements in Odense.
| Name | Status | Municipality | Population Estimate 2006-01-01 | Population Estimate 2011-01-01 | Population Estimate 2016-01-01 | Population Estimate 2021-01-01 | Population Estimate 2025-01-01 | |
|---|---|---|---|---|---|---|---|---|
| Allese (Allesø) | Urban Settlement | Odense | 253 | 265 | 280 | 267 | 261 | → |
| Åsum | Urban Settlement | Odense | 259 | 260 | 360 | 499 | 503 | → |
| Bellinge | Urban Settlement | Odense | 4,176 | 4,505 | 4,632 | 5,202 | 5,877 | → |
| Blommenslyst | Urban Settlement | Odense | 324 | 474 | 554 | 530 | 544 | → |
| Brændekilde | Urban Settlement | Odense | 299 | 314 | 312 | 332 | 304 | → |
| Bredbjerg | Urban Settlement | Nordfyn / Odense | 237 | 247 | 231 | 224 | 235 | → |
| Davinde | Urban Settlement | Odense | 236 | 223 | 221 | 241 | 244 | → |
| Ejlstrup | Urban Settlement | Odense | 1,098 | 1,320 | 1,330 | 1,323 | 1,266 | → |
| Fangel | Urban Settlement | Odense | 472 | 463 | 470 | 452 | 447 | → |
| Fraugde | Urban Settlement | Odense | 997 | 1,764 | 1,898 | 2,093 | 2,009 | → |
| Holmstrup | Urban Settlement | Odense | 251 | 262 | 244 | 226 | 222 | → |
| Lumby | Urban Settlement | Odense | 676 | 778 | 788 | 797 | 818 | → |
| Næsbyhoved-Broby | Urban Settlement | Odense | 1,187 | 1,458 | 1,514 | 1,518 | 1,548 | → |
| Odense | Urban Settlement | Odense | 165,759 | 167,615 | 175,245 | 180,760 | 185,480 | → |
| Over Holluf | Urban Settlement | Odense | 1,342 | 1,526 | 1,552 | 1,578 | 1,488 | → |
| Sankt Klemens | Urban Settlement | Odense | 2,666 | 2,553 | 2,905 | 3,214 | 3,183 | → |
| Seden Strand | Urban Settlement | Odense | 330 | 325 | 339 | 317 | 327 | → |
| Skallebølle | Urban Settlement | Assens / Odense | 658 | 679 | 692 | 699 | 712 | → |
Source: Denmark Statistik.
