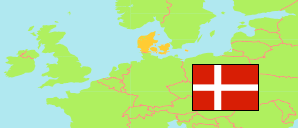
Lemvig
Municipality in Midtjylland
Municipality
The population development of Lemvig.
| Name | Status | Population Estimate 2006-01-01 | Population Estimate 2011-01-01 | Population Estimate 2016-01-01 | Population Estimate 2021-01-01 | Population Estimate 2025-01-01 | |
|---|---|---|---|---|---|---|---|
| Lemvig | Municipality | 22,483 | 21,554 | 20,399 | 19,607 | 18,800 | → |
| Midtjylland [Mid Jutland] | Region | 1,219,725 | 1,260,993 | 1,293,309 | 1,332,048 | 1,373,799 |
Contents: Urban Settlements
The population development of the urban settlements in Lemvig.
| Name | Status | Municipality | Population Estimate 2006-01-01 | Population Estimate 2011-01-01 | Population Estimate 2016-01-01 | Population Estimate 2021-01-01 | Population Estimate 2025-01-01 | |
|---|---|---|---|---|---|---|---|---|
| Bækmarksbro | Urban Settlement | Lemvig | 543 | 550 | 520 | 519 | 524 | → |
| Bøvlingbjerg | Urban Settlement | Lemvig | 582 | 569 | 525 | 500 | 457 | → |
| Gudum | Urban Settlement | Lemvig | 207 | 203 | 202 | ... | 214 | → |
| Harboøre | Urban Settlement | Lemvig | 1,709 | 1,605 | 1,506 | 1,431 | 1,339 | → |
| Klinkby | Urban Settlement | Lemvig | 379 | 361 | 471 | 467 | 431 | → |
| Lemvig | Urban Settlement | Lemvig | 7,128 | 7,140 | 6,929 | 6,852 | 6,741 | → |
| Lomborg | Urban Settlement | Lemvig | 349 | 344 | 331 | 339 | 326 | → |
| Nørre Nissum | Urban Settlement | Lemvig | 1,120 | 1,029 | 1,038 | 1,014 | 988 | → |
| Ramme | Urban Settlement | Lemvig | 468 | 437 | 404 | 407 | 366 | → |
| Thyborøn | Urban Settlement | Lemvig | 2,455 | 2,241 | 2,092 | 1,936 | 1,740 | → |
Source: Denmark Statistik.
