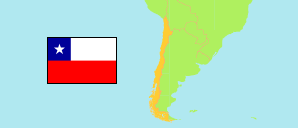
Valparaíso
Region in Chile
Contents: Subdivision
The population development in Valparaíso as well as related information and services (Wikipedia, Google, images).
| Name | Status | Population Estimate 2002-07-01 | Population Estimate 2007-07-01 | Population Estimate 2012-07-01 | Population Estimate 2017-07-01 | Population Projection 2023-07-01 | |
|---|---|---|---|---|---|---|---|
| Valparaíso | Region | 1,597,346 | 1,688,072 | 1,787,099 | 1,885,948 | 2,010,849 | |
| Isla de Pascua [Easter Island] | Province | 3,952 | 5,291 | 6,563 | 7,648 | 8,743 | → |
| Los Andes | Province | 93,947 | 99,733 | 105,925 | 111,997 | 119,516 | → |
| Marga Marga | Province | 287,611 | 310,101 | 333,985 | 358,067 | 388,865 | → |
| Petorca | Province | 73,230 | 75,691 | 78,400 | 81,004 | 84,288 | → |
| Quillota | Province | 182,408 | 191,112 | 201,040 | 211,219 | 224,340 | → |
| San Antonio | Province | 141,247 | 151,653 | 162,806 | 173,601 | 186,762 | → |
| San Felipe de Aconcagua | Province | 135,948 | 143,553 | 151,953 | 160,456 | 171,347 | → |
| Valparaíso | Province | 679,003 | 710,938 | 746,427 | 781,956 | 826,988 | → |
| Chile | Republic | 15,691,701 | 16,517,933 | 17,443,491 | 18,419,192 | 19,960,889 |
Source: Instituto Nacional de Estadísticas.
Explanation: All tabulated population figures consider the results of the 2017 census.
Further information about the population structure:
| Gender (P 2023) | |
|---|---|
| Males | 983,195 |
| Females | 1,027,654 |
| Age Groups (P 2023) | |
|---|---|
| 0-17 years | 432,167 |
| 18-64 years | 1,255,399 |
| 65+ years | 323,283 |
| Age Distribution (P 2023) | |
|---|---|
| 80+ years | 80,627 |
| 70-79 years | 140,386 |
| 60-69 years | 219,976 |
| 50-59 years | 243,934 |
| 40-49 years | 260,836 |
| 30-39 years | 292,274 |
| 20-29 years | 289,739 |
| 10-19 years | 254,001 |
| 0-9 years | 229,076 |
| Urbanization (C 2017) | |
|---|---|
| Rural | 163,327 |
| Urban | 1,652,575 |
| Country of Birth (C 2017) | |
|---|---|
| Chile | 1,775,737 |
| South America | 25,589 |
| Central America & Caribbean | 5,103 |
| North America | 1,924 |
| Europe | 5,927 |
| Other country & undeclared | 1,622 |