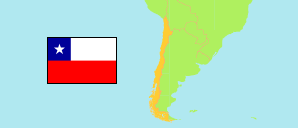
Tarapacá
Region in Chile
Contents: Subdivision
The population development in Tarapacá as well as related information and services (Wikipedia, Google, images).
| Name | Status | Population Estimate 2002-07-01 | Population Estimate 2007-07-01 | Population Estimate 2012-07-01 | Population Estimate 2017-07-01 | Population Projection 2023-07-01 | |
|---|---|---|---|---|---|---|---|
| Tarapacá | Region | 246,265 | 275,014 | 308,251 | 342,129 | 401,588 | |
| Iquique | Province | 227,236 | 254,814 | 285,020 | 315,989 | 370,877 | → |
| Tamarugal | Province | 19,029 | 20,200 | 23,231 | 26,140 | 30,711 | → |
| Chile | Republic | 15,691,701 | 16,517,933 | 17,443,491 | 18,419,192 | 19,960,889 |
Source: Instituto Nacional de Estadísticas.
Explanation: All tabulated population figures consider the results of the 2017 census.
Further information about the population structure:
| Gender (P 2023) | |
|---|---|
| Males | 202,347 |
| Females | 199,241 |
| Age Groups (P 2023) | |
|---|---|
| 0-17 years | 105,907 |
| 18-64 years | 259,115 |
| 65+ years | 36,566 |
| Age Distribution (P 2023) | |
|---|---|
| 80+ years | 6,889 |
| 70-79 years | 15,638 |
| 60-69 years | 30,749 |
| 50-59 years | 40,658 |
| 40-49 years | 54,603 |
| 30-39 years | 71,104 |
| 20-29 years | 65,308 |
| 10-19 years | 57,512 |
| 0-9 years | 59,127 |
| Urbanization (C 2017) | |
|---|---|
| Rural | 20,493 |
| Urban | 310,065 |
| Country of Birth (C 2017) | |
|---|---|
| Chile | 286,919 |
| South America | 40,146 |
| Central America & Caribbean | 731 |
| North America | 112 |
| Europe | 378 |
| Other country & undeclared | 2,272 |