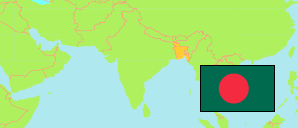
Bogra
District in Bangladesh
Contents: Population
The population development of Bogra as well as related information and services (Wikipedia, Google, images).
| Name | Status | Transcription | Native | Population Census 1991-03-13 | Population Census 2001-01-22 | Population Census 2011-03-15 | Population Census 2022-06-14 | |
|---|---|---|---|---|---|---|---|---|
| Bogra | District | Baguṛā | বগুড়া জেলা | 2,799,000 | 3,151,389 | 3,539,293 | 3,815,192 | |
| Bangladesh | People's Republic | Bā̃lādēśa | বাংলাদেশ | 111,456,000 | 130,522,598 | 149,772,364 | 169,828,911 |
Source: Bangladesh Bureau of Statistics.
Explanation: The totals are adjusted for underenumeration; the population structure presents unadjusted figures. The 2022 population of districts is adjusted by using the official adjustment factor of the corresponding division.
Further information about the population structure:
| Gender (C 2022) | |
|---|---|
| Males | 1,853,102 |
| Females | 1,880,861 |
| Hijra | 334 |
| Urbanization (C 2022) | |
|---|---|
| Rural | 961,354 |
| Urban | 2,772,943 |
| Ethnic Group (C 2022) | |
|---|---|
| Bengalis | 3,727,969 |
| Ethnic Minorities | 5,994 |
| Religion (C 2022) | |
|---|---|
| Muslim | 3,515,831 |
| Hindu | 216,649 |
| Buddhist | 828 |
| Christian | 201 |
| Other Religion | 454 |