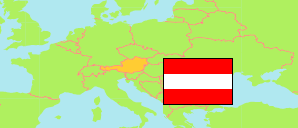
Oberösterreich (Austria)
State
The population development of Oberösterreich.
| Name | Status | Population Census 1981-05-12 | Population Census 1991-05-15 | Population Census 2001-05-15 | Population Census 2011-10-31 | Population Census 2021-10-31 | Population Estimate 2024-01-01 | |
|---|---|---|---|---|---|---|---|---|
| Oberösterreich [Upper Austria] | State | 1,269,545 | 1,333,480 | 1,376,607 | 1,413,762 | 1,504,237 | 1,530,571 | → |
| Österreich [Austria] | Republic | 7,555,338 | 7,795,786 | 8,032,857 | 8,401,940 | 8,969,068 | 9,159,993 |
Contents: Agglomerations
The population development of the agglomerations in Oberösterreich.
| Name | Status | State(s) | Population Census 1981-05-12 | Population Census 1991-05-15 | Population Census 2001-05-15 | Population Census 2011-10-31 | Population Census 2021-10-31 | Population Estimate 2024-01-01 | |
|---|---|---|---|---|---|---|---|---|---|
| Ansfelden | Agglomeration | Oberösterreich | 13,324 | 14,636 | 14,789 | 15,672 | 17,703 | 18,257 | → |
| Braunau am Inn | Agglomeration | Oberösterreich | 16,318 | 16,264 | 16,332 | 16,197 | 17,498 | 17,647 | → |
| Gmunden | Agglomeration | Oberösterreich | 35,449 | 37,523 | 39,721 | 40,599 | 42,417 | 42,775 | → |
| Linz | Agglomeration | Oberösterreich | 250,456 | 257,293 | 240,071 | 250,197 | 272,950 | 278,663 | → |
| Ried im Innkreis | Agglomeration | Oberösterreich | 15,229 | 16,061 | 16,875 | 17,166 | 18,795 | 19,125 | → |
| Steyr | Agglomeration | Oberösterreich | 49,571 | 50,394 | 51,188 | 50,861 | 50,944 | 51,331 | → |
| Vöcklabruck | Agglomeration | Oberösterreich | 42,621 | 44,071 | 45,998 | 47,933 | 50,426 | 51,341 | → |
| Wels | Agglomeration | Oberösterreich | 69,602 | 73,294 | 78,938 | 83,379 | 91,001 | 93,578 | → |
Source: Statistik Austria.
Explanation: An agglomeration corresponds to the core zone of a city region according to the definition of 2001; only in case of Vienna its satellite towns are added. Agglomerations are compiled from communes in their boundaries of 2024. 2024 population figures are preliminary estimates.