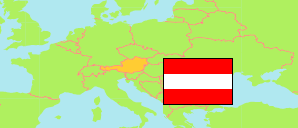
Tirol
State in Austria
Contents: Subdivision
The population development in Tirol as well as related information and services (Wikipedia, Google, images).
| Name | Status | Population Census 1981-05-12 | Population Census 1991-05-15 | Population Census 2001-05-15 | Population Census 2011-10-31 | Population Census 2021-10-31 | Population Estimate 2025-01-01 | |
|---|---|---|---|---|---|---|---|---|
| Tirol [Tyrol] | State | 586,663 | 631,410 | 673,543 | 709,319 | 762,652 | 777,773 | |
| Imst | District | 42,358 | 46,833 | 52,656 | 56,557 | 61,372 | 62,688 | → |
| Innsbruck-Land | District | 125,299 | 141,334 | 154,934 | 166,762 | 182,750 | 186,743 | → |
| Innsbruck-Stadt | District | 117,287 | 118,112 | 113,457 | 119,617 | 130,385 | 132,499 | → |
| Kitzbühel | District | 49,747 | 54,127 | 59,185 | 61,705 | 64,812 | 66,067 | → |
| Kufstein | District | 76,966 | 84,627 | 93,704 | 101,047 | 111,778 | 114,229 | → |
| Landeck | District | 37,553 | 40,207 | 42,795 | 43,591 | 44,328 | 45,030 | → |
| Lienz | District | 47,494 | 48,338 | 50,395 | 49,319 | 48,872 | 49,011 | → |
| Reutte | District | 27,370 | 29,140 | 31,583 | 31,618 | 33,219 | 33,946 | → |
| Schwaz | District | 62,589 | 68,692 | 74,834 | 79,103 | 85,136 | 87,447 | → |
| Österreich [Austria] | Republic | 7,555,338 | 7,795,786 | 8,032,857 | 8,401,940 | 8,969,068 | 9,197,213 |
Source: Statistik Austria.
Explanation: 2025 population figures are final estimates.
Further information about the population structure:
| Gender (E 2025) | |
|---|---|
| Males | 384,002 |
| Females | 393,658 |
| Age Groups (E 2025) | |
|---|---|
| 0-17 years | 133,424 |
| 18-64 years | 490,231 |
| 65+ years | 154,005 |
| Age Distribution (E 2025) | |
|---|---|
| 90+ years | 7,061 |
| 80-89 years | 39,394 |
| 70-79 years | 63,165 |
| 60-69 years | 101,332 |
| 50-59 years | 114,650 |
| 40-49 years | 101,593 |
| 30-39 years | 109,094 |
| 20-29 years | 92,686 |
| 10-19 years | 74,058 |
| 0-9 years | 74,627 |
| Citizenship (E 2025) | |
|---|---|
| Austria | 629,835 |
| EU, EFTA, UK | 95,655 |
| Other Citizenship | 52,170 |
| Country of Birth (E 2025) | |
|---|---|
| Austria | 613,214 |
| EU, EFTA, UK | 95,950 |
| Other country | 68,496 |
