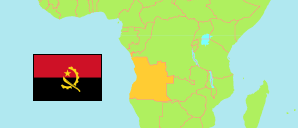
Uíge
Province in Angola
Contents: Subdivision
The population in Uíge as well as related information and services (Wikipedia, Google, images).
| Name | Status | Population Census 2014-05-16 | |
|---|---|---|---|
| Uíge | Province | 1,483,118 | |
| Alfândega | Commune | 3,864 | → |
| Alto-Zaza | Commune | 20,020 | → |
| Ambuíla (Sede Mantoyo) | Commune | 12,528 | → |
| Bembe | Commune | 12,423 | → |
| Bengo | Commune | 11,474 | → |
| Beu | Commune | 18,770 | → |
| Bungo | Commune | 37,153 | → |
| Caiongo | Commune | 14,952 | → |
| Camatambo | Commune | 3,264 | → |
| Cambamba | Commune | 4,278 | → |
| Cuango | Commune | 19,194 | → |
| Cuilo-Cambozo (Camboso) | Commune | 9,935 | → |
| Cuilo-Futa | Commune | 9,873 | → |
| Cuilo Pombo | Commune | 9,972 | → |
| Damba | Commune | 23,458 | → |
| Dimuca | Commune | 11,556 | → |
| Icoca | Commune | 22,414 | → |
| Kangola | Commune | 27,293 | → |
| Kinvuenga | Commune | 9,104 | → |
| Lemboa | Commune | 4,960 | → |
| Lombe (N'sosso) | Commune | 27,189 | → |
| Lucunga | Commune | 11,849 | → |
| Mabaia | Commune | 8,682 | → |
| Macocola | Commune | 20,433 | → |
| Macolo | Commune | 4,932 | → |
| Maquela do Zombo | Commune | 68,030 | → |
| Massau | Commune | 10,408 | → |
| Negage | Commune | 114,949 | → |
| Nova Esperança (Buengas) | Commune | 34,516 | → |
| Pete-Cusso (Sacamo, Nkuso) | Commune | 7,601 | → |
| Puri | Commune | 37,910 | → |
| Quibocolo | Commune | 8,311 | → |
| Quifuafua (Vista Alegre) | Commune | 8,349 | → |
| Quimbele | Commune | 74,869 | → |
| Quimbianda (Buenga Sul) | Commune | 12,797 | → |
| Quinzala | Commune | 38,542 | → |
| Quipedro (Kimpetelu) | Commune | 5,589 | → |
| Quisseque | Commune | 11,054 | → |
| Quitende (Aldeia Viçosa) | Commune | 5,701 | → |
| Quitexe | Commune | 15,969 | → |
| Sacandica | Commune | 22,368 | → |
| Santa Cruz (Milunga) | Commune | 14,824 | → |
| Sanza Pombo | Commune | 42,681 | → |
| Songo | Commune | 52,578 | → |
| Uando | Commune | 5,432 | → |
| Uíge | Commune | 519,196 | → |
| Wamba | Commune | 11,874 | → |
| Angola | Republic | 25,789,024 |
Source: Instituto Nacional de Estatística, República de Angola (web).
Explanation: Communes in the boundaries during the 2014 census. Their area figures are derived from imprecise geometries.
Further information about the population structure:
| Gender (C 2014) | |
|---|---|
| Males | 728,693 |
| Females | 754,425 |
| Age Groups (C 2014) | |
|---|---|
| 0-14 years | 741,932 |
| 15-64 years | 691,134 |
| 65+ years | 50,052 |
| Age Distribution (C 2014) | |
|---|---|
| 0-9 years | 577,200 |
| 10-19 years | 295,884 |
| 20-29 years | 207,314 |
| 30-39 years | 142,369 |
| 40-49 years | 106,254 |
| 50-59 years | 77,033 |
| 60-69 years | 45,062 |
| 70-79 years | 23,092 |
| 80+ years | 8,910 |
| Literacy (A15+) (C 2014) | |
|---|---|
| yes | 441,913 |
| no | 299,273 |
| Religion (C 2014) | |
|---|---|
| Catholic | 352,542 |
| Protestant | 950,833 |
| Indigenous religion | 106,328 |
| Muslim | 4,269 |
| Jew | 1,512 |
| Other religion | 41,574 |
| No religion | 26,060 |