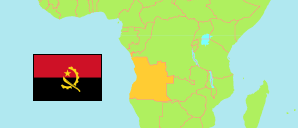
Ganda
Municipality in Angola
Contents: Population
The population development of Ganda as well as related information and services (Wikipedia, Google, images).
| Name | Status | Population Census 2014-05-16 | Population Projection 2022-07-01 | |
|---|---|---|---|---|
| Ganda | Municipality | 235,486 | 290,122 | |
| Angola | Republic | 25,789,024 | 33,086,278 |
Source: Instituto Nacional de Estatística, República de Angola (web).
Explanation: Area figures of municipalities are derived from imprecise geometries.
Further information about the population structure:
| Gender (P 2022) | |
|---|---|
| Males | 136,676 |
| Females | 153,446 |
| Age Groups (C 2014) | |
|---|---|
| 0-14 years | 122,608 |
| 15-64 years | 104,164 |
| 65+ years | 8,714 |
| Age Distribution (C 2014) | |
|---|---|
| 0-9 years | 93,772 |
| 10-19 years | 49,560 |
| 20-29 years | 25,954 |
| 30-39 years | 21,361 |
| 40-49 years | 18,620 |
| 50-59 years | 12,995 |
| 60-69 years | 7,712 |
| 70-79 years | 4,115 |
| 80+ years | 1,396 |
| Urbanization (C 2014) | |
|---|---|
| Rural | 160,651 |
| Urban | 74,834 |
| Literacy (A15+) (C 2014) | |
|---|---|
| yes | 53,215 |
| no | 59,663 |
| Spoken Language(s) (C 2014) | |
|---|---|
| Portuguese | 123,472 |
| Umbundu | 167,033 |
| Kimbundu | 2,619 |
| Kikongo | 1,564 |
| Chokwe | 1,661 |
| Nganguela | 1,614 |
| Nhaneca | 1,844 |
| Fiote/Ibinda | 2,375 |
| Cuanhama | 1,649 |
| Luvale | 1,594 |
| Muhumbi | 1,560 |
| Deaf-mute | 1,610 |
| Other language | 1,667 |
| Religion (C 2014) | |
|---|---|
| Catholics | 194,085 |
| Protestants | 38,851 |
| Indigenous religion | 50 |
| Muslims | 41 |
| Jews | 309 |
| Other religion | 466 |
| No religion | 1,683 |
