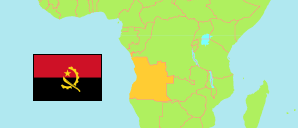
Moxico
Province in Angola
Contents: Subdivision
The population development in Moxico as well as related information and services (Wikipedia, Google, images).
| Name | Status | Population Census 2014-05-16 | Population Projection 2022-07-01 | |
|---|---|---|---|---|
| Moxico | Province | 758,568 | 964,426 | |
| Alto Zambeze | Municipality | 110,900 | 140,998 | → |
| Bundas | Municipality | 69,496 | 88,352 | → |
| Camanongue | Municipality | 34,167 | 43,441 | → |
| Cameia (Lumeje) | Municipality | 29,476 | 37,475 | → |
| Léua | Municipality | 32,457 | 41,266 | → |
| Luacano | Municipality | 20,755 | 26,387 | → |
| Luau | Municipality | 89,453 | 113,722 | → |
| Luchazes | Municipality | 14,451 | 18,376 | → |
| Luena | Municipality | 357,413 | 454,409 | → |
| Angola | Republic | 25,789,024 | 33,086,278 |
Source: Instituto Nacional de Estatística, República de Angola (web).
Explanation: Area figures of municipalities are derived from imprecise geometries.
Further information about the population structure:
| Gender (P 2022) | |
|---|---|
| Males | 472,365 |
| Females | 492,061 |
| Age Groups (C 2014) | |
|---|---|
| 0-14 years | 383,988 |
| 15-64 years | 352,449 |
| 65+ years | 22,132 |
| Age Distribution (C 2014) | |
|---|---|
| 0-9 years | 295,294 |
| 10-19 years | 157,822 |
| 20-29 years | 111,008 |
| 30-39 years | 77,262 |
| 40-49 years | 50,528 |
| 50-59 years | 32,370 |
| 60-69 years | 19,354 |
| 70-79 years | 10,219 |
| 80+ years | 4,711 |
| Urbanization (C 2014) | |
|---|---|
| Rural | 341,283 |
| Urban | 417,285 |
| Literacy (A15+) (C 2014) | |
|---|---|
| yes | 178,388 |
| no | 196,192 |
| Spoken Language(s) (C 2014) | |
|---|---|
| Portuguese | 292,662 |
| Umbundu | 47,943 |
| Kimbundu | 3,703 |
| Kikongo | 6,689 |
| Chokwe | 321,134 |
| Nganguela | 47,677 |
| Nhaneca | 4,807 |
| Fiote/Ibinda | 5,375 |
| Cuanhama | 1,582 |
| Luvale | 149,862 |
| Muhumbi | 1,811 |
| Deaf-mute | 3,185 |
| Other language | 85,629 |
| Religion (C 2014) | |
|---|---|
| Catholics | 104,985 |
| Protestants | 473,540 |
| Indigenous religion | 3,790 |
| Muslims | 1,732 |
| Jews | 1,111 |
| Other religion | 32,378 |
| No religion | 141,032 |
