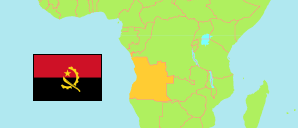
Huambo
Province in Angola
Contents: Subdivision
The population development in Huambo as well as related information and services (Wikipedia, Google, images).
| Name | Status | Population Census 2014-05-16 | Population Projection 2022-07-01 | |
|---|---|---|---|---|
| Huambo | Province | 2,019,555 | 2,645,080 | |
| Bailundo | Municipality | 294,494 | 385,674 | → |
| Caála | Municipality | 279,792 | 366,480 | → |
| Catchiungo | Municipality | 120,677 | 158,050 | → |
| Ecunha (Ekunha) | Municipality | 82,541 | 108,103 | → |
| Huambo | Municipality | 713,134 | 934,127 | → |
| Londuimbale | Municipality | 134,254 | 175,790 | → |
| Longonjo | Municipality | 92,103 | 120,625 | → |
| Mungo | Municipality | 113,417 | 148,518 | → |
| Tchikala-Tcholohanga | Municipality | 103,646 | 135,743 | → |
| Tchinjenje | Municipality | 30,443 | 39,866 | → |
| Ukuma | Municipality | 55,054 | 72,104 | → |
| Angola | Republic | 25,789,024 | 33,086,278 |
Source: Instituto Nacional de Estatística, República de Angola (web).
Explanation: Area figures of municipalities are derived from imprecise geometries.
Further information about the population structure:
| Gender (P 2022) | |
|---|---|
| Males | 1,271,313 |
| Females | 1,373,767 |
| Age Groups (C 2014) | |
|---|---|
| 0-14 years | 1,043,636 |
| 15-64 years | 926,719 |
| 65+ years | 49,199 |
| Age Distribution (C 2014) | |
|---|---|
| 0-9 years | 800,794 |
| 10-19 years | 450,930 |
| 20-29 years | 279,404 |
| 30-39 years | 179,796 |
| 40-49 years | 139,243 |
| 50-59 years | 92,253 |
| 60-69 years | 46,003 |
| 70-79 years | 22,144 |
| 80+ years | 8,987 |
| Urbanization (C 2014) | |
|---|---|
| Rural | 1,056,352 |
| Urban | 963,203 |
| Literacy (A15+) (C 2014) | |
|---|---|
| yes | 583,381 |
| no | 392,537 |
| Spoken Language(s) (C 2014) | |
|---|---|
| Portuguese | 1,228,930 |
| Umbundu | 1,280,280 |
| Kimbundu | 24,933 |
| Kikongo | 11,129 |
| Chokwe | 13,024 |
| Nganguela | 15,530 |
| Nhaneca | 9,826 |
| Fiote/Ibinda | 23,817 |
| Cuanhama | 9,303 |
| Luvale | 8,548 |
| Muhumbi | 8,399 |
| Deaf-mute | 8,634 |
| Other language | 15,298 |
| Religion (C 2014) | |
|---|---|
| Catholics | 1,136,490 |
| Protestants | 804,311 |
| Indigenous religion | 860 |
| Muslims | 1,819 |
| Jews | 3,200 |
| Other religion | 39,269 |
| No religion | 33,605 |
