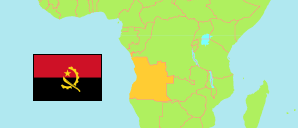
Benguela
Province in Angola
Contents: Subdivision
The population development in Benguela as well as related information and services (Wikipedia, Google, images).
| Name | Status | Population Census 2014-05-16 | Population Projection 2022-07-01 | |
|---|---|---|---|---|
| Benguela | Province | 2,231,385 | 2,749,300 | |
| Baía Farta | Municipality | 107,841 | 132,873 | → |
| Balombo | Municipality | 108,965 | 134,248 | → |
| Benguela | Municipality | 561,775 | 692,202 | → |
| Bocoio | Municipality | 164,685 | 202,890 | → |
| Caimbambo | Municipality | 90,838 | 111,916 | → |
| Catumbela | Municipality | 175,805 | 216,623 | → |
| Chongoroi | Municipality | 87,278 | 107,533 | → |
| Cubal | Municipality | 305,632 | 376,542 | → |
| Ganda | Municipality | 235,486 | 290,122 | → |
| Lobito | Municipality | 393,079 | 484,351 | → |
| Angola | Republic | 25,789,024 | 33,086,278 |
Source: Instituto Nacional de Estatística, República de Angola (web).
Explanation: Area figures of municipalities are derived from imprecise geometries.
Further information about the population structure:
| Gender (P 2022) | |
|---|---|
| Males | 1,310,140 |
| Females | 1,439,160 |
| Age Groups (C 2014) | |
|---|---|
| 0-14 years | 1,071,842 |
| 15-64 years | 1,101,874 |
| 65+ years | 57,668 |
| Age Distribution (C 2014) | |
|---|---|
| 0-9 years | 807,045 |
| 10-19 years | 485,168 |
| 20-29 years | 332,239 |
| 30-39 years | 226,043 |
| 40-49 years | 174,136 |
| 50-59 years | 114,687 |
| 60-69 years | 56,118 |
| 70-79 years | 25,471 |
| 80+ years | 10,477 |
| Urbanization (C 2014) | |
|---|---|
| Rural | 803,395 |
| Urban | 1,427,990 |
| Literacy (A15+) (C 2014) | |
|---|---|
| yes | 733,450 |
| no | 426,093 |
| Spoken Language(s) (C 2014) | |
|---|---|
| Portuguese | 1,438,997 |
| Umbundu | 1,172,473 |
| Kimbundu | 24,030 |
| Kikongo | 14,593 |
| Chokwe | 13,890 |
| Nganguela | 12,117 |
| Nhaneca | 15,216 |
| Fiote/Ibinda | 20,977 |
| Cuanhama | 11,647 |
| Luvale | 10,893 |
| Muhumbi | 19,273 |
| Deaf-mute | 10,751 |
| Other language | 20,682 |
| Religion (C 2014) | |
|---|---|
| Catholics | 1,552,690 |
| Protestants | 538,738 |
| Indigenous religion | 1,363 |
| Muslims | 1,768 |
| Jews | 3,567 |
| Other religion | 36,716 |
| No religion | 96,543 |
