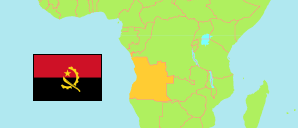
Cuanza Sul
Province in Angola
Contents: Subdivision
The population development in Cuanza Sul as well as related information and services (Wikipedia, Google, images).
| Name | Status | Population Census 2014-05-16 | Population Projection 2022-07-01 | |
|---|---|---|---|---|
| Cuanza Sul | Province | 1,881,873 | 2,370,936 | |
| Amboim (Gabela) | Municipality | 242,444 | 305,471 | → |
| Cassongue | Municipality | 151,917 | 191,371 | → |
| Cela (Waku Kungo) | Municipality | 225,520 | 284,115 | → |
| Conda | Municipality | 89,479 | 112,738 | → |
| Ebo | Municipality | 165,129 | 208,041 | → |
| Libolo (Calulo) | Municipality | 92,069 | 116,003 | → |
| Mussende | Municipality | 82,544 | 103,996 | → |
| Porto Amboim | Municipality | 125,969 | 158,713 | → |
| Quibala | Municipality | 142,057 | 179,007 | → |
| Quilenda | Municipality | 97,648 | 123,034 | → |
| Seles (Uku Seles) | Municipality | 187,127 | 235,747 | → |
| Sumbe (Ngangula) | Municipality | 279,968 | 352,700 | → |
| Angola | Republic | 25,789,024 | 33,086,278 |
Source: Instituto Nacional de Estatística, República de Angola (web).
Explanation: Area figures of municipalities are derived from imprecise geometries.
Further information about the population structure:
| Gender (P 2022) | |
|---|---|
| Males | 1,150,690 |
| Females | 1,220,246 |
| Age Groups (C 2014) | |
|---|---|
| 0-14 years | 920,448 |
| 15-64 years | 905,564 |
| 65+ years | 55,861 |
| Age Distribution (C 2014) | |
|---|---|
| 0-9 years | 707,315 |
| 10-19 years | 398,967 |
| 20-29 years | 264,425 |
| 30-39 years | 186,694 |
| 40-49 years | 139,679 |
| 50-59 years | 97,207 |
| 60-69 years | 50,529 |
| 70-79 years | 25,409 |
| 80+ years | 11,647 |
| Urbanization (C 2014) | |
|---|---|
| Rural | 1,158,829 |
| Urban | 723,044 |
| Literacy (A15+) (C 2014) | |
|---|---|
| yes | 529,591 |
| no | 431,835 |
| Spoken Language(s) (C 2014) | |
|---|---|
| Portuguese | 1,452,512 |
| Umbundu | 416,996 |
| Kimbundu | 473,351 |
| Kikongo | 7,539 |
| Chokwe | 3,578 |
| Nganguela | 2,562 |
| Nhaneca | 1,343 |
| Fiote/Ibinda | 13,601 |
| Cuanhama | 2,827 |
| Luvale | 1,304 |
| Muhumbi | 2,249 |
| Deaf-mute | 1,722 |
| Other language | 13,278 |
| Religion (C 2014) | |
|---|---|
| Catholics | 511,896 |
| Protestants | 617,902 |
| Indigenous religion | 1,131 |
| Muslims | 1,913 |
| Jews | 2,664 |
| Other religion | 43,639 |
| No religion | 702,728 |
