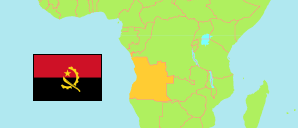
Cuanza Norte
Province in Angola
Contents: Subdivision
The population development in Cuanza Norte as well as related information and services (Wikipedia, Google, images).
| Name | Status | Population Census 2014-05-16 | Population Projection 2022-07-01 | |
|---|---|---|---|---|
| Cuanza Norte | Province | 443,386 | 554,749 | |
| Ambaca | Municipality | 61,769 | 77,259 | → |
| Banga | Municipality | 10,354 | 12,960 | → |
| Bolongongo | Municipality | 13,019 | 16,289 | → |
| Cambambe | Municipality | 90,766 | 113,596 | → |
| Cazengo | Municipality | 171,743 | 214,851 | → |
| Golungo Alto | Municipality | 33,834 | 42,334 | → |
| Lucala | Municipality | 22,674 | 28,370 | → |
| Ngonguembo | Municipality | 7,576 | 9,481 | → |
| Quiculungo | Municipality | 9,732 | 12,178 | → |
| Samba Cajú | Municipality | 21,918 | 27,429 | → |
| Angola | Republic | 25,789,024 | 33,086,278 |
Source: Instituto Nacional de Estatística, República de Angola (web).
Explanation: Area figures of municipalities are derived from imprecise geometries.
Further information about the population structure:
| Gender (P 2022) | |
|---|---|
| Males | 274,480 |
| Females | 280,269 |
| Age Groups (C 2014) | |
|---|---|
| 0-14 years | 214,483 |
| 15-64 years | 215,564 |
| 65+ years | 13,339 |
| Age Distribution (C 2014) | |
|---|---|
| 0-9 years | 162,797 |
| 10-19 years | 92,267 |
| 20-29 years | 66,057 |
| 30-39 years | 44,888 |
| 40-49 years | 32,557 |
| 50-59 years | 23,668 |
| 60-69 years | 12,791 |
| 70-79 years | 6,245 |
| 80+ years | 2,116 |
| Urbanization (C 2014) | |
|---|---|
| Rural | 143,028 |
| Urban | 300,358 |
| Literacy (A15+) (C 2014) | |
|---|---|
| yes | 140,915 |
| no | 87,988 |
| Spoken Language(s) (C 2014) | |
|---|---|
| Portuguese | 367,547 |
| Umbundu | 11,411 |
| Kimbundu | 138,830 |
| Kikongo | 10,698 |
| Chokwe | 980 |
| Nganguela | 779 |
| Nhaneca | 624 |
| Fiote/Ibinda | 2,063 |
| Cuanhama | 300 |
| Luvale | 131 |
| Muhumbi | 132 |
| Other language | 8,035 |
| Deaf-mute | 470 |
| Religion (C 2014) | |
|---|---|
| Catholic | 262,772 |
| Protestant | 94,106 |
| Indigenous religion | 108 |
| Muslim | 421 |
| Jew | 1,014 |
| Other religion | 11,865 |
| No religion | 73,099 |
